From real time modelling to crisis management
I have already written here two articles dealing with the experimental flood forecasting pilot set up in partnership with GEOMOD around the solution ICM Live (sorry, only available en French for now) :
- Real-time modeling: the article briefly describes the operation of an automated modeling system
- Cascading simulations: this article presents the principle of simulations triggered at the detection of certain events in data flows or in a simplified global simulation
We will address here in a broader set the complete configuration of the tool and the operational uses that can be made.
Note: Flood forecasting and crisis management are the responsibility of public authorities, this article is only intended to present tools and technical solutions to facilitate forecasting and warning processes.
The modeling system
We saw in the first article the sequence of actions carried out by the system :
- Different data flows (measurements of the rainfall on the ground, levels and flow from the public stations, Météo France AROME weather forecasts, etc...) are collected automatically by the system and formatted to be used as inputs to the hydrological and hydraulic models
- Simulations are run automatically at a defined interval according to operational expectations, over a time range before and after t0 consistent with:
- the availability of meteorological forecast data (for example AROME Météo France data allow a 42-hour forecast from their origin)
- the dynamics of events, in order to capture the whole of a typical event (from genesis to the descent of the flood)
- gross modeling results are automatically post-processed to produce exploitable elements from the operational point of view.
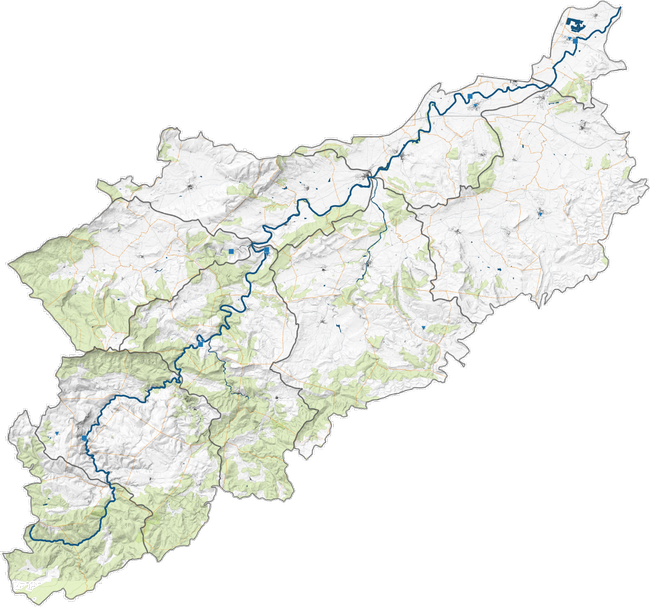
Rainfall sensor data flow
Production of a reliable forecast
The objective of forecasters and modellers is of course to reduce as much as possible the uncertainties that occur at each level of the treatment chain :
- uncertainties on weather forecasts,
- uncertainties on the previous hydrological conditions,
- reliability of the hydrological and hydraulic responses simulated by the model
- unpredictable events disturbing the known operation of the monitored sector (stationarity of a storm cell, rupture of a dike, etc ...).
In this perspective, rather than proposing a single forecast, we will produce a set of scenarios, giving a forecasting trend, which will be refined with each new data acquired (when the rainy event reaches for example the monitored sector, the measures gradually replace the weather forecast as a source of inputs, the simulations are relaunched and enriched with this new, more realistic data).
from modeling to crisis management
The raw results of modeling (levels, speeds, flows) are not the most appropriate outputs for effective crisis management.
The real-time system is thus configured to provide automatic post processing, and produce more operational elements and grounded in reality:
Alerts are defined to exceeding certain levels of values and / or rates in some key points of the monitored network the system, we take in particular the different levels of vigilance at the scale limits commonly used in the Municipal Plans of Safeguarding, and that the elected officials know well.
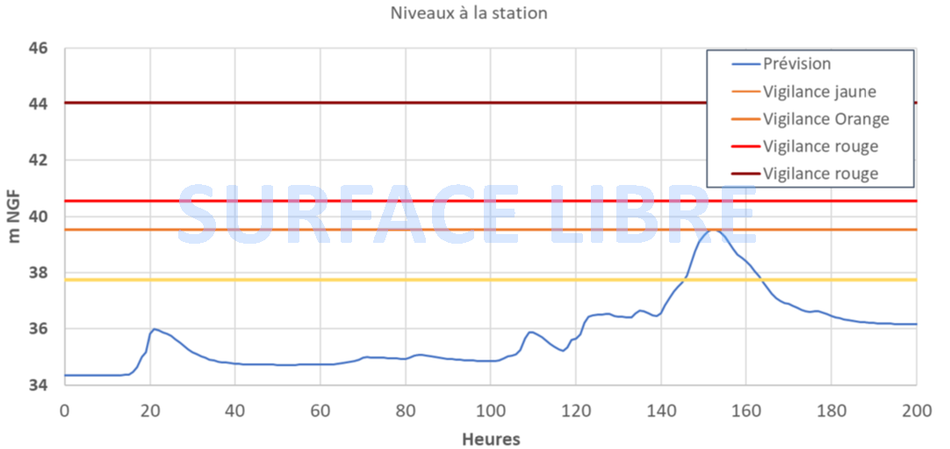
Levels of vigilance
These alerts can also concern various variables that one wishes to monitor on the sector:
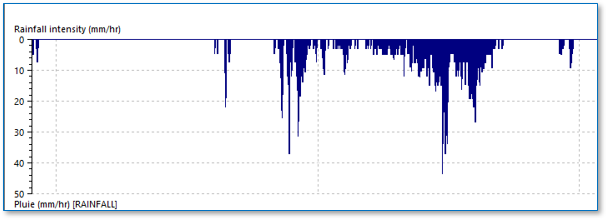
- cumulative values and / or maximum intensities of rain fallen on watersheds of contribution
Thresholds of alert fixed on the forecast meteorological: the triangles indicate the exceeding of a certain intensity
- The reaching by the flood of specific stakes or places,
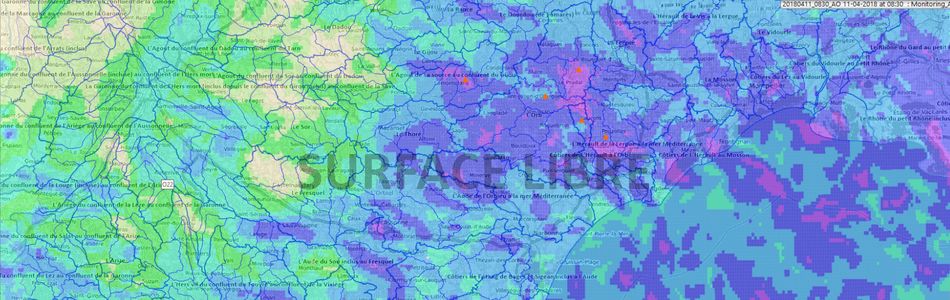
These alerts are then transcribed in the form of synthetic tables or posted on the cartographic interface for quick interpretation.
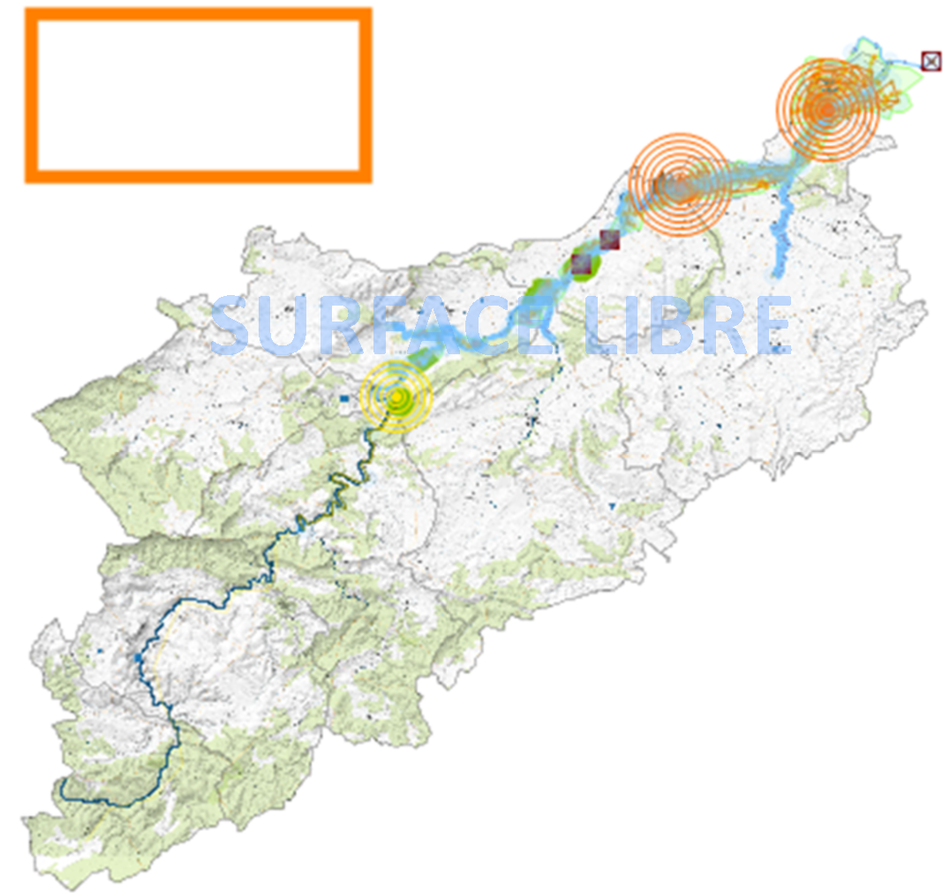
For example, here is a synthetic view of the watershed with alert levels at the 3 reference stations. Two stations are in orange alert, one is in yellow alert during the forecast. The maximum alert level of the monitored area is displayed on the polygon on the left.
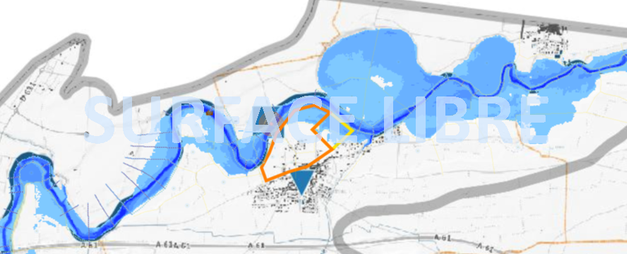
The second view is a local focus. It displays the flood area calculated automatically by crossing with a digital terrain model and provides additional detail on alert levels, representing the areas of interest listed in the PCS and their respective alertness levels in the forecast.
The sharing of operational information
The information produced is only exploited if it can be easily shared by the actors in charge of crisis management.
Several options are then possible:
- the automatic sending of alerts when thresholds are exceeded, by email or by SMS
- the automatic transfer of system outputs via an FTP. The system will automatically produce the projected hydrographs and limnigrams, as well as the projected map views and GIS layers.
- the integration of these outputs (flooded zones, affected places, projected hydrographs and limnigrams) directly into a webmapping platform open to crisis management stakeholders, which will enable them to visualize the projected results, to display parallel scenarios known floods, add the actions performed in the field, and share these elements via the platform directly or PDF extractions.
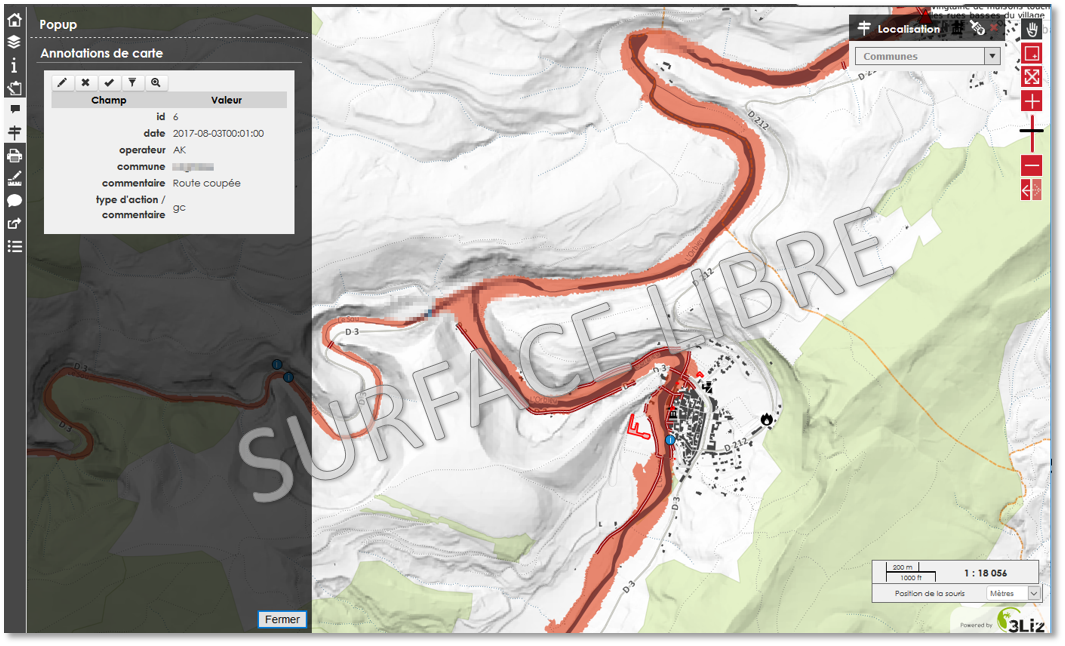
Webmapping platform integrating the data from the forecast
To know more
I will be present at the event organized from 14 to 16 November 2018 in Avignon by the SHF "From flood forecasting to crisis management" with Geomod on their stand, to propose demonstrations of the real-time experimental pilot.
I will also be at Pollutec exhibition, from 27 to 30 November in Lyon Eurexpo, also available for demonstrations of these tools.
To learn more, do not hesitate to contact me via the contact form, and also to see our specific section related tools and services on the site.